As we wrote in our market review article we published at the end of last year, equities to the end of November saw strong returns. We mentioned that investors therefore might expect more muted returns in 2018, given the last two years of exceptional performance. Additionally, we provided a simulated past performance of our model portfolios, employing the following assumptions:
– Identical asset allocation we have in our models along with the same ETFs are used;
– 0.48% investment management fee is charged; and
– Rebalance exercise of the portfolio on a semi-annual basis.

In the article above, we provided returns up to end of November only and, as such, wanted to update the numbers to end of December to provide performance for the entire year.
The simulated performance numbers as at 31 December 2017 can be found below:
| ASSET ALLOCATIONS | GBP | EUR | USD |
|---|---|---|---|
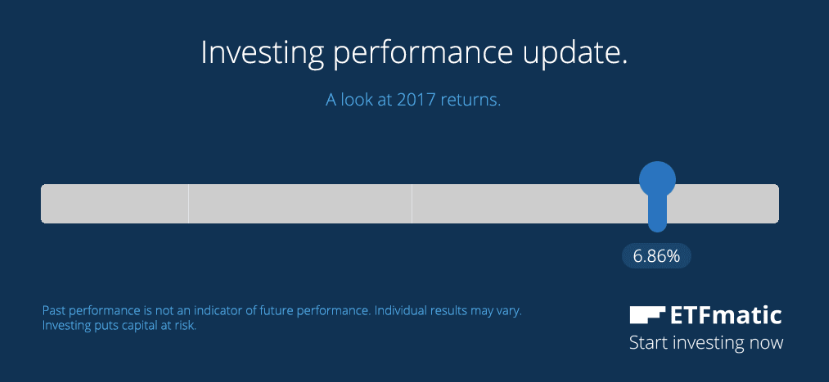
| 20% Fixed Income/80% Equity | 12.04% | 6.86% | 14.25% |
| 50% Fixed Income/50% Equity | 8.06% | 4.36% | 9.76% |
| 80% Fixed Income/20% Equity | 4.15% | 1.88% | 4.35% |
The table above is based on simulated past performance. It assumes a hypothetical GBP/EUR/USD 1000 is invested into the same asset allocation as our model portfolios. We use the same ETFs, rebalance the portfolio every 6 months and have assumed a 0.48% investment management fee.
As our starter portfolio investment style has now surpassed its 12 months milestone, we are now able to start publishing performance numbers on some of our client starter goals. Please note that we may only provide the performance numbers of actual goals that have been invested for 12 months or more. In order to fully reflect the true performance of an asset allocation and allow us to provide performance numbers, the following requirements have to be met:
A goal must be balanced before December 2016, meaning that sufficient funds have been provided so as to ensure we can buy all the ETFs to match a client’s target asset allocation;
A goal’s target asset allocation has not be changed by the client over the period (as this would distort the final returns).
We are sometimes asked why we don’t provide performance numbers. To answer that, we wrote an article about it, but wanted to stress once more the importance of finding the right asset allocation in order to achieve the types of risk and returns that meet your expectations. Below, we have selected our most used asset allocations in the 32 European countries we serve. Over time, as more months pass, we will be able to provide actual returns, net of fees, for a variety of currencies and asset allocations.
| GOAL CURRENCY | ASSET ALLOCATION | 30/12/2016 – 29/12/2017 |
|---|---|---|
| EUR | 100% Equities | 8.44% |
| EUR | 80% Equities/20% Fixed income | 6.48% |


